
Optimizing Your Website - Bounce Rate
How To Lower Your Bounce Rate
As we talked about in Monday's blog update, your bounce rate is one of the top 5 KPIs that we recommend you monitor and optimize for in order to increase opportunity for your business. In today's blog we'll be walking you through step by step on how to identify trouble areas. We'll also be providing our recommendations on how you can fix any problems you find by updating your content to provide a clear call to action which will encourage further browsing.
Before we jump into the step-by-step walk-through, let's quickly recap what the bounce rate of your website represents, why it's important to monitor and the benchmarks we recommend you aim for.
Bounce Rate
The bounce rate of your website is the percentage of people who land on your website and then leave without taking any further action (i.e. clicking another link and/or visiting another page). This is an extremely important metric to monitor because people who bounce from your website may not have found the information they were looking for.
When you provide a very clear call to action and have strong content, consumers will typically continue to engage, ideally until they've taken an action that you desire (Make a purchase, book an appointment, etc). By optimizing for this KPI you will not only improve the customer experience but you will also be creating many more sales opportunities.
Benchmark
You should aim to make sure your bounce rate is no more than 50% and ideally under 40%.
Where To Find Your Bounce Rate in Google Analytics
The first step in optimizing your bounce rate is to find out what your bounce rate currently is. We recommend measuring this with a full year worth of data if possible because that will help minimize any potential seasonality issues. To find your bounce rate simply follow the steps below:
- Log in to Google Analytics
- Navigate to the "Audience" reporting section and select "Overview"
- Adjust the date range to account for a full year of data if possible

You can also sort the graph by "Bounce Rate" by selecting the drop-down box just under the "Overview" tab to see how your bounce rate has been fluctuating on a month-by-month, week-by-week or day-by-day basis. Note: We don't recommend sorting day-by-day in an analysis of more than 30 days.

In this case we see that the bounce rate for this particular site over the past year is 48.98% which is lower than our benchmark, good news! However, there is always room for improvement so let's take a look at individual pages to see if we can find a particular page where people may be bouncing more often than others.
To examine individual pages we need to navigate to the "Behavior" reporting section. The behavior reports can be accessed from the left hand navigation and this particular report is found under Behavior > Site Content > All Pages
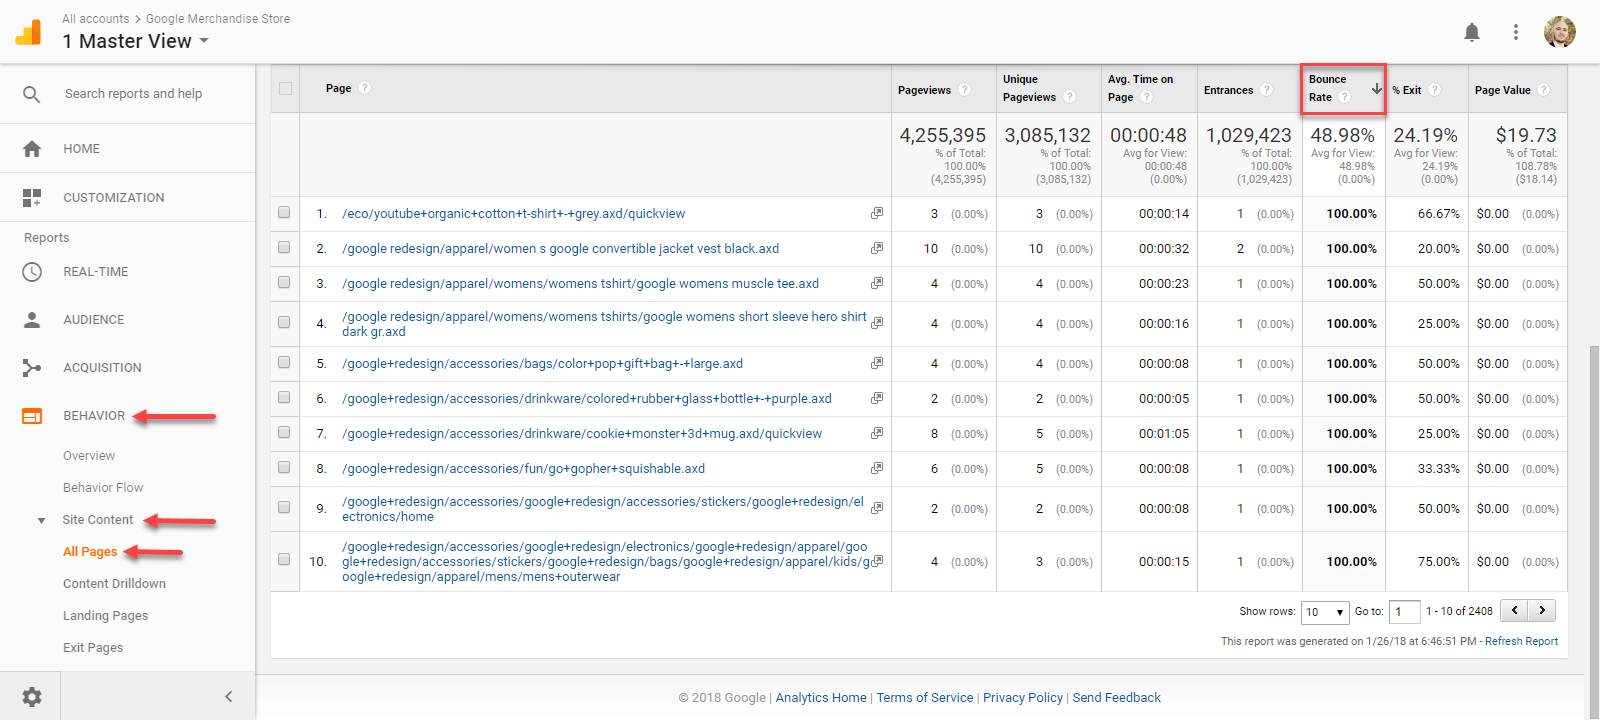
Once you have accessed the report we recommend sorting by the bounce rate. This can be accomplished by clicking on the "Bounce Rate" column as outlined in red in the image above. Clicking on the "Bounce Rate" column will then sort the data from highest bounce rate to lowest and you can see the individual pages.
As you can see in the example above, there are numerous pages with a "100%" bounce rate, meaning no users landed on that page and then moved on to other sections of the website. This is a great way to identify any potential pages with errors on your website that are preventing consumers from engaging further. You can click on any of the pages to review them directly on the website to see if you can duplicate the issue. If not, a little more analysis may be required to fix things up. Remember, a clear call to action is crucial so customers can find their way around.
Advanced Tip: While optimizing for the pages with a 100% bounce rate is incredibly helpful, it's also important to find other pages that have high bounce rates that may be slightly lower. By applying a filter we can search for specific bounce rates, between 80% and 95% and review those pages as well. See below for an example:

By identifying the pages on your website with high bounce rates and making simple changes you can greatly improve the user experience for your customers. Just remember to always make sure there is a clear call to action and compelling content and you'll soon be reaping the benefits.
Conclusion
Lowering the bounce rate on your website is a great way to drive more revenue and increase customer satisfaction. Often, a simple change can make an enormous difference in engagement and that can lead to more opportunities. If you already have a prominent call to action on your page such as a button or link to view more content, try to test small changes like increasing the size of the button or changing the color. You can then re-evaluate the pages to see if the changes are making a difference for you. Whatever you do, don't give up! Consistent improvements on your website over time will pay dividends and your customers will thank you.
Be sure to check out our blog next Friday as we review how to optimize for Pages per Session and Avg. Session Duration. These two critical metrics will help you identify how engaged customers are when they visit your website and how you can increase that engagement through creative content and linking best practices.
Interested in learning more about how Trustworthy Digital can help your business achieve success in digital marketing & analytics? We would love to chat with you. Simply fill out our contact form by clicking the link below and we will get back to you as soon as possible.